To use all functions of this page, please activate cookies in your browser.
My watch list
my.bionity.com
my.bionity.com
With an accout for my.bionity.com you can always see everything at a glance – and you can configure your own website and individual newsletter.
- My watch list
- My saved searches
- My saved topics
- My newsletter
4 Infographics about the topic spectroscopy
rss| You can refine your search further. Select from the filter options on the left to narrow down your results. |
Analytical Chemistry
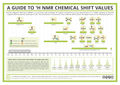
A Guide to Proton Nuclear Magnetic Resonance (NMR)
Today’s graphic is one for the chemists, with a guide to chemical shifts in proton nuclear magnetic resonance.At first glance, for those without a background in chemistry, this may well look largely nonsensical – however, if you’re interested in learning a little more about how chemists can work ...
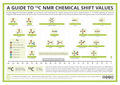
A Guide to 13-C Nuclear Magnetic Resonance (NMR)
Analytical Chemistry
In previous entries in the Analytical Chemistry series of graphics, we’ve looked at some of the tools that chemists can use to determine the identity of compounds in various samples, including infrared spectroscopy and hydrogen nuclear magnetic resonance (NMR). Today looks another similar method, ...
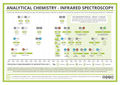
Infrared (IR) Spectroscopy
Analytical Chemistry
I’ve been covering infrared spectroscopy recently with one of my A level classes, and realised that I haven’t really come across an aesthetically appealing reference chart for the frequencies of absorption – which seemed like as good an excuse as any to make one myself. So, here it is! Now, if ...
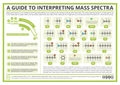
Mass Spectrometry and Interpreting Mass Spectra
For the fourth in the analytical chemistry series, we turn to mass spectrometry. So far, we’ve looked at how chemists can determine the presence of particular bonds present in molecules with infrared spectroscopy, and how they can gain information about the structure of molecules using hydrogen ...
Page 1 From 1

