To use all functions of this page, please activate cookies in your browser.
My watch list
my.bionity.com
my.bionity.com
With an accout for my.bionity.com you can always see everything at a glance – and you can configure your own website and individual newsletter.
- My watch list
- My saved searches
- My saved topics
- My newsletter
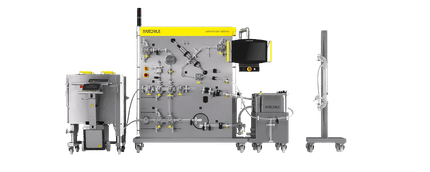
Electrical penetration graphThe electrical penetration graph or EPG is a system used by biologists to study the interaction of insects such as aphids and leafhoppers with plants. Therefore, it can also be used to study the basis of plant virus transmission, host plant selection by insects and the way in which insects can find and feed from the phloem of the plant. It is a simple system consisting of a partial circuit which is only completed when a species such as aphids, which are the most abundantly studied, inserts its stylet into the plant in order to probe the plant as a suitable host for feeding. The completed circuit is displayed visually as a graph with different waveforms indicating either different insect activities such as saliva excretion or the ingestion of cellular contents or indicating which tissue type has been penetrated (i.e. phloem, xylem or mesophyll). So far, around ten different graphical waveforms are known, correlating with different insect/plant interaction events. The CircuitProduct highlightThe circuit connects to the insect via a 20mm gold wire and to the plant via a copper electrode placed in the soil. The circuit also passes through, normally, a one Gohm resistor and a 50x amplifier before the results are stored digitally and interpreted by a computer to calculate the final graph.
See also
|
| This article is licensed under the GNU Free Documentation License. It uses material from the Wikipedia article "Electrical_penetration_graph". A list of authors is available in Wikipedia. |

Last viewed


